Metrics
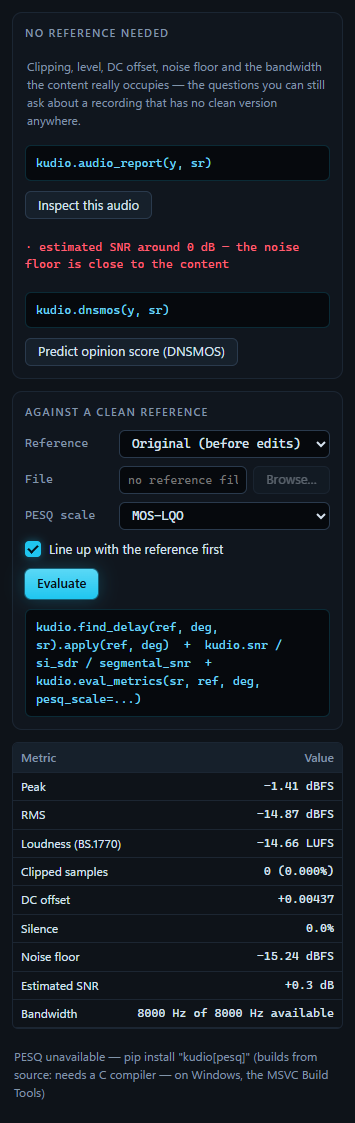
Two kinds of question about the clip. Is the recording any good, which you can ask of anything, and how close is it to a clean version of itself, which needs that clean version. The top half answers the first with no reference at all, the bottom half the second, and one table under both shows whichever ran last. Each button comes with a line naming the kudio call behind it.
Every measurement here is of the whole clip. The selection makes no difference.
Inspect this audio
Inspect this audio runs kudio.audio_report on the clip and fills the
table:
| Row | What it is |
|---|---|
| Peak | the loudest sample, in dBFS; silence when every sample is zero |
| RMS | the average level, in dBFS |
| Loudness (BS.1770) | integrated loudness in LUFS. Without a figure the row says why: silence when every sample is zero, n/a (shorter than 400 ms) for a clip under one 400 ms gating block, and n/a for a clip with NaN or inf in it, or one so quiet that every block falls under BS.1770's −70 LUFS gate |
| Clipped samples | samples on a flat top at full scale, in runs of three or more, and their share of the clip |
| DC offset | the mean sample value; a healthy recording sits at zero |
| Silence | the share of 30 ms frames more than 40 dB below the loud ones |
| Noise floor | the level of the quietest frames, the 10th percentile, in dBFS |
| Estimated SNR | the loud frames (95th percentile) against the noise floor. An estimate from one signal, not a measurement against a clean one |
| Bandwidth | how high the content reaches, against what the sample rate allows |
A sample or two touching full scale is not counted as clipping, and neither is float audio that goes past 1.0 while still tracing its waveform. Only a flat run pinned at the rail is information that is gone.
Under the button goes what is wrong with the recording, one line per problem, in the warning colour:
| The line says | When |
|---|---|
… samples are not finite (NaN or inf) |
a corrupt clip. It comes alone, since every other figure is meaningless then |
the clip is digital silence |
every sample is zero |
… samples clipped (…% of the clip) |
any clipped run at all |
peaks at … dBFS, past full scale |
float audio above 0 dBFS that has not clipped yet. It will, the moment it is written to an integer format |
peaks at … dBFS, right against the ceiling |
a peak above −0.5 dBFS |
peaks at only … dBFS — very quiet |
a peak below −30 dBFS |
DC offset of … |
an offset above 0.01 either way |
content stops at … Hz although the file claims … Hz |
content ending below 90% of half the sample rate, which usually means it was upsampled |
…% of the clip is silence |
more than 60% silence |
estimated SNR around … dB |
an estimated SNR under 10 dB |
With none of them, the line reads:
Nothing wrong with the recording itself. This says the audio is technically
sound, not that it sounds good — for that, try the DNSMOS button below.
The Levels readout on the Inspect panel runs the same check all the time, and shows the figures you look at most. This table has the ones behind them, for when you want the noise floor or the DC offset as a number.
DNSMOS
audio_report says whether a recording is technically sound. Whether it
sounds good is a judgement, and without a listening panel the only way to one
is a model trained on listeners. Predict opinion score (DNSMOS) runs
DNSMOS (ITU-T P.835) through kudio.dnsmos and fills the table with three
scores on the usual 1 to 5 scale:
| Row | What it rates |
|---|---|
| SIG (speech) | the speech itself, ignoring the background |
| BAK (background) | how unobtrusive the background is |
| OVRL (overall) | the whole thing |
| Windows averaged | how many 9-second windows the scores are the mean of |
I show all three rather than one average because SIG and BAK move in opposite directions under denoising. Suppress harder and the background gets cleaner while the speech gets eaten, and an average would hide exactly the trade you are trying to judge.
Under the button goes one line of plain words. It calls OVRL 4.0 and above
clean, 3.0 and above usable, 2.0 and above poor, and anything lower
bad, and adds a note when SIG and BAK are more than 0.7 apart:
poor (OVRL 2.55) — the background is cleaner than the speech, which is what
over-aggressive denoising looks like
The other note, for SIG well above BAK, says the speech survived but the background is still intrusive.
The model was trained at 16 kHz on 9.01-second windows, so the clip is resampled to 16 kHz and scored a window at a time, one second apart. A clip shorter than one window is repeated until it fills one, not padded with silence, which the model would score as ruined speech: 2 s of audio becomes 16 s and seven windows.
What DNSMOS needs
Two things, and neither comes with a plain install:
- onnxruntime, from
pip install "kudiostudio[dnsmos]"; - the model weights,
sig_bak_ovr.onnx. They belong to Microsoft's DNS-Challenge and are distributed there, so neither kudio nor KudioStudio ships them. Clone https://github.com/microsoft/DNS-Challenge and point theKUDIO_DNSMOS_DIRenvironment variable at itsDNSMOSfolder before you startkudiostudio. The variable can also name the file itself. The panel callskudio.dnsmos(y, sr)with nomodel_dir, so the variable is the only way it finds them.
Without either, the panel shows kudio's own message in full, because it says where to get what is missing. Troubleshooting has both messages and the commands.
Against a clean reference
Every quality metric compares the clip with a clean version of it. A synthetic dataset has one. A real recording never does: its original is the noisy one, so scoring against it measures how much you changed the audio, not whether you improved it.
Reference chooses what to compare against:
Original (before edits)- the clip as it was opened or recorded. This is a clean reference only when what you opened was clean. Open a clean take, add noise or a room in Effects, denoise it in Enhance, and Evaluate scores the denoiser against where you started.
File…- a file chosen in File. It is read in mono and at the clip's sample rate, resampled if it has to be, so a reference at another rate still compares sample for sample.
Evaluate first measures the offset between the two (next section), then
fills the table with what numpy alone can give: SNR, SI-SDR,
Segmental SNR, and Compared samples, how many samples were scored. PESQ,
STOI and SDR are computed on a job and join the table when it finishes. A
back-end that is missing leaves its row saying so
(below).
Lining up first
Every metric here compares sample i of the reference with sample i of the clip. Here is one take scored against a copy of itself delayed by 128 samples, 8 ms at 16 kHz:
Nothing in the second number says "these two are misaligned" rather than "the
processing destroyed the signal", and those mean opposite things. So the
offset is measured with kudio.find_delay on every Evaluate, and goes in the
table as the first row:
lags means the clip comes later than the reference, leads that it comes
earlier, and polarity inverted is added when one of the two is upside down.
An inverted copy is the same take with something in the chain flipped, which
is worth knowing, so it is reported rather than corrected.
Line up with the reference first, on by default, takes the offset out
before scoring: both signals are trimmed to the stretch they share, which is
why Compared samples can come out a little shorter than the clip. The
status bar says what was taken out:
This clip lags by 128 samples (8.0 ms), correlation 1.000; lined up with the
reference before scoring.
Turn it off to score the two as they are. The offset is still measured and reported, with a warning row:
When the correlation at the best offset is under 0.5, the two are not the same recording, whatever the switch says:
⚠ Reference        these do not look like the same recording — the scores
                   below are about two unrelated signals
The panel then scores them without lining them up. Cross-correlation always finds some best offset, and two unrelated signals aligned on it would give a confident-looking number about nothing, which is worse than an obviously bad one.
Which metric needs what
| Metric | Needs | Notes |
|---|---|---|
| SNR, SI-SDR, Segmental SNR | nothing; numpy | always there |
| STOI | pip install "kudiostudio[eval]" |
about 0.4 s of speech once silence is removed |
| SDR | pip install "kudiostudio[eval]" |
BSS-SDR, from mir_eval |
| PESQ | pip install "kudio[pesq]" |
builds from source and needs a C compiler, on Windows the MSVC Build Tools. 8 or 16 kHz only |
| DNSMOS | pip install "kudiostudio[dnsmos]" and the weights |
above |
PESQ has an extra of its own because it compiles. Put in [eval] or [all],
it would stop either from installing on a machine without a compiler.
The line under the table says which back-ends are there, and for each one that is not, the command that installs it:
PESQ unavailable — pip install "kudio[pesq]" (builds from source: needs a C
compiler — on Windows, the MSVC Build Tools)
The commands name kudio's extras. kudiostudio[eval] installs the same as
kudio[eval], and PESQ has no KudioStudio extra at all. A row with no score
says which of three things happened, since they need different answers:
not installed: the back-end is missing;not defined at 44100 Hz (PESQ is 8 or 16 kHz): PESQ is installed, but the standard covers those two rates only;could not be computed for this pair: installed and defined, and it still failed on these two signals, such as STOI on a clip with too little speech in it.
Calling all three "not installed" would tell you to install what you already
have. The back-ends are looked for once per run, so restart kudiostudio
after installing one.
PESQ: MOS-LQO or raw
PESQ comes on two scales, and PESQ scale chooses which one the table
shows. The row says which it is, PESQ (MOS-LQO) or PESQ (raw P.862).
- MOS-LQO
- the default, and what kudio reports unless asked otherwise: the score mapped onto the MOS scale both standards define. At 16 kHz it is wideband PESQ (P.862.2), at 8 kHz narrowband.
- raw P.862
- the narrowband score before the P.862.1 mapping, from −0.5 to 4.5: what the ITU reference program prints, and what most speech-enhancement papers quote. At 16 kHz this means running PESQ in narrowband mode as well, since P.862.2 defines no raw score.
They are different scales, not different roundings. A raw 2.03 is about 1.66 MOS-LQO, so a table of raw scores set against a paper's MOS-LQO, or the other way round, compares two numbers that cannot be compared. Check which one the paper quotes before you put yours beside it.